Map of Extreme Weather in 2012

2012 was a year of extreme weather events, with record heat waves, significant drought across the Southern and Western States, and major wildfires. A map posted by the Natural Resources Defense Council (NRDC) allows users to watch the events on the national map over the course of the year.

The map also allows user to look at a summary of extreme weather events at the state level.

2013-06-09_NRDC extreme weather map_Fullscreen capture 692013 23624 PM

According to the NRDC, in 2012 California experienced:

  • Record-breaking heat in 15 counties
  • Record-breaking snow in 5 counties
  • Record-breaking precipitation in 18 counties
  • 102 large wildfires

The website lets users see the specific records set (for example, the records for monthly highest maximum temperature below) and the previous record.

2013-06-09_NRDC extreme weather map_Fullscreen capture 692013 24150 PM

For those (like me) who like to know the source of the data, the map was based on data from the National Oceanic and Atmospheric Administrations’s National Climatic Data Center.

UC Berkeley myPower Website

Yesterday, UC Berkeley announced several new energy-related tools designed to reduced campus energy use. From the email announcement:

Starting April 3, 2012, the campus community can visit the myPower website to see real-time energy use data for 57 campus buildings. … These dashboards will provide evidence of the cumulative impact of the energy-saving measures you and others in your building take, demonstrating that small actions can add up to a large impact.  The website also provides information about proven ways to save energy in offices, labs, and residence halls.

The screenshot above shows the dashboard for Wurster Hall, which houses the Department of Architecture, among others. I’ll be checking out some of the other campus buildings over the next few days.

Worldwide Parking Rate Survey

1

Colliers International published its 2011 “Global Central Business District Parking Rate Survey,” and the main verdict is that the cost of parking a car went up, in general, over the last year. However, the United States was an exception.

For the nerdy, the report lists average daily and monthly parking rates for a number of major cities. Did you know that in Tirana, Albania, the daily parking rate is equivalent to $6.18, but that in Oslo, Norway, the daily rate is $89.04? Or that in Bakersfield it is $8.00, but that San Francisco it is $26? Of the cities evaluated, San Francisco makes both the list of the top 50 most expensive daily rates and the 50 most expensive monthly rates.

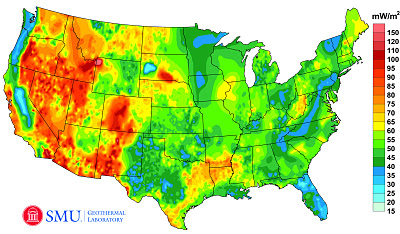
Geothermal Map of the United States

1

Image Credit: Google Green Blog

According to the Google Green Blog, a recently completed project to update the Geothermal Map of North America by SMU Geothemal Laboratory (supported by Google.org), estimates that the technical potential of geothermal energy exceeds 2,980,295 megawatts. More details can be found on the blog here.

Google has also worked to develop this information as a layer in Google Earth. The file can be downloaded from a link towards the bottom of this page. The map shows Enhanced Geothermal Systems (EGS) Potential from depths from 3km to 6.5km and excludes protected lands such as National Parks.

An important note: I am not in any way endorsing EGS. Messing with the Earth at big scales makes me nervous, since we have so little information on the potential impact of our actions. I live in earthquake territory. Also, I read this alarming article in the New York Times a couple years ago. An excerpt:

All seemed to be going well — until Dec. 8, 2006, when the project [in Basel, Switzerland] set off an earthquake, shaking and damaging buildings and terrifying many…

As early as this week, though, an American start-up company, AltaRock Energy, will begin using nearly the same method to drill deep into ground laced with fault lines in an area two hours’ drive north of San Francisco.

…For geothermal energy to be used more widely, engineers need to find a way to draw on the heat at deeper levels percolating in the earth’s core.

Some geothermal advocates believe the method used in Basel, and to be tried in California, could be that breakthrough. But because large earthquakes tend to originate at great depths, breaking rock that far down carries more serious risk, seismologists say. Seismologists have long known that human activities can trigger quakes, but they say the science is not developed enough to say for certain what will or will not set off a major temblor.

It is well worth reading the entire article. And it is well worth remembering that just because it is called “clean” energy does not mean that there are no potential hazards associated with the energy production and use.

Energy-Related Recovery Act Money

1

 I’ve been having quite a bit of fun investigating where some of the energy-related recovery act money has gone via the interactive map here. If you zoom in to look at the Bay Area, you can hover your mouse over each circle to see who received the money and how much. For example, the City of Berkeley received $118,155 for a renewable energy project, and Fremont received $1,891,200 for energy efficiency.

2011 State Energy Efficiency Scorecard

– – –

The American Council for an Energy Efficient Economy (ACEEE) has posted its 2011 State Energy Efficiency Scorecard. California is ranked #2, behind Massachusetts.

You can see the California information here.

The full scorecard ranking can be found online here.